





 Nederlands
 Italiano
 Português
 Română
 Español
 Ελληνικά
 Polski
 Türkçe




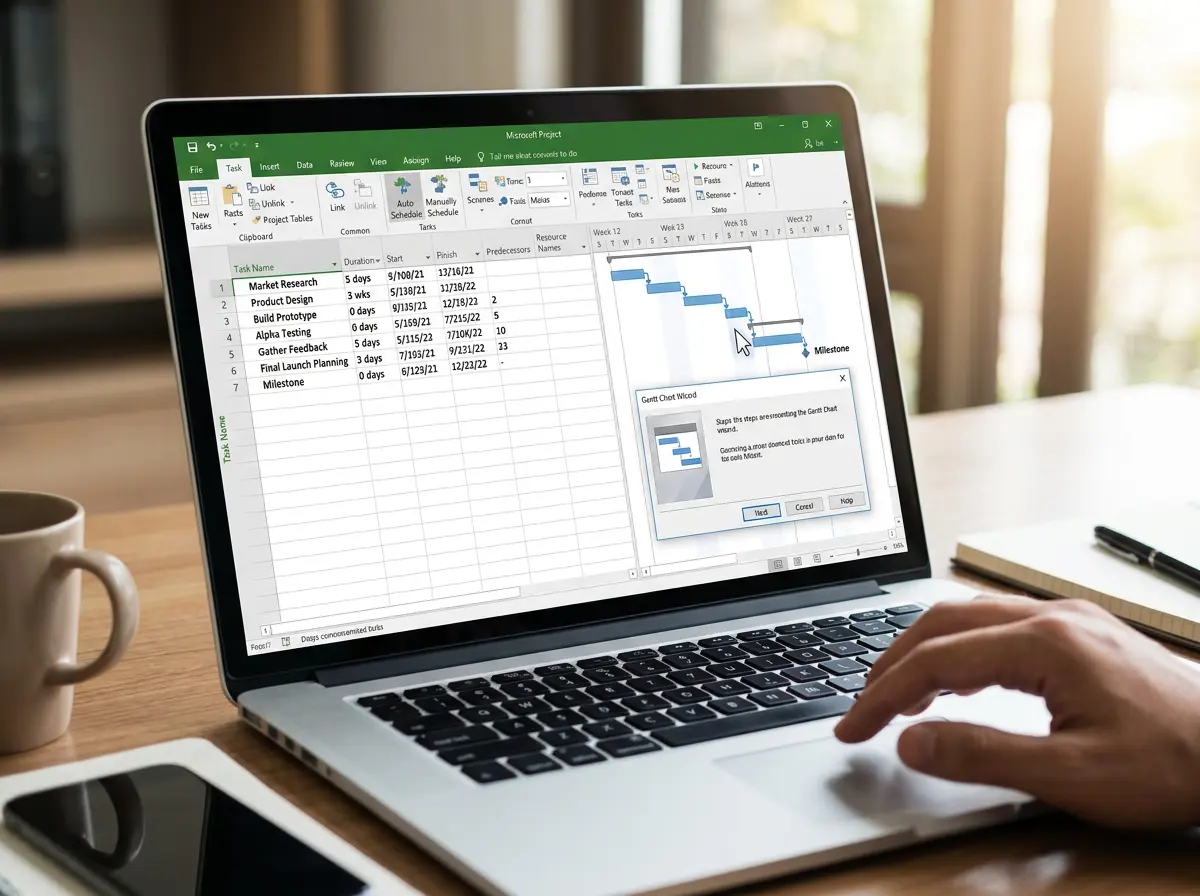
Someone opens Microsoft Project for the first time, usually because IT pushed it out across the department, and stares at a blank grid that looks like a spreadsheet crossed with a calendar. If they’re searching for how to make a gantt chart in microsoft project, this is usually the moment they get stuck. Obvious next move? Hunt through the Insert menu for a “Gantt chart” button. That button doesn’t exist. And the confusion that follows is the single most common reason first-timers give up on the software in ten minutes.
So here’s the thing nobody selling a rival tool wants to explain: the Gantt chart isn’t something you insert or draw. It generates itself. Every bar in that timeline is just a visual reflection of a row in the table on the left. Type a task, give it a duration, and a bar appears on its own. Link two tasks and an arrow draws itself between them.
Point is, the whole workflow runs backwards from what most people expect. You build a task list, and the chart is the byproduct.
Quick Summary: Building a Gantt chart in Microsoft Project depends on three things done in order: entering your task list, setting durations, then linking dependencies. The chart draws itself from that table as you type, so there’s nothing to insert. There’s also a Gantt Chart Wizard for formatting, but it’s hidden by default and has to be added to the ribbon manually.
Why beginners get stuck before they start
Most guides ranking for this topic are published by companies selling competing software. They frame Project as some intimidating fortress, walk through a few steps, then pivot to “or you could just use our tool instead.” What they skip is the one mental model that makes everything click.
And the confusion is structural. You launch straight into the Gantt Chart view (it’s the default), but the right-hand timeline sits empty because there are no tasks yet. New users see blank space where they expected a chart and assume something’s broken.
Nothing’s broken. The canvas is just waiting for data.
Microsoft’s own documentation is blunt about it. Bars are drawn from the Start, Finish, and Duration fields in the Gantt Chart view’s task table, and once those exist, the picture appears. That’s the entire trick.
How to make a Gantt chart in Microsoft Project: the actual build order
Let’s break down the sequence that works, because doing these steps out of order is exactly where people trip.
Step one, the task list. Click into the first cell under Task Name and type your first task. Press Enter, type the next one. Keep going until every piece of work is listed, one per row. Ignore dates for now – at this stage you’re just outlining what needs doing.
Step two, durations. Move to the Duration column and enter how long each task takes, say “3 days” or “2 wks”. The moment you commit a duration, a blue bar appears on the right, positioned against the timeline. This is the first time most people see the chart actually respond, and it’s the moment the whole thing starts making sense.
By default Project schedules new tasks manually, which means bars can sit wherever you last left them. Switching each task to Auto Scheduled (there’s a toggle on the Task tab) lets Project calculate positions from durations and links instead. For a first real project timeline gantt build, auto scheduling saves a lot of manual dragging.
Step three, dependencies. This is where the chart stops looking like a stack of loose bars and turns into a plan. Select two tasks that run in sequence, then click the Link button – the chain icon on the Task tab. Project draws an arrow from the end of the first bar to the start of the second, and shifts the second task’s dates so it can’t begin until the first finishes.
Every bar you see is a row you typed. Link the rows and the arrows draw themselves. There is no separate “make a chart” step because the table is the chart.
Link the rest of your dependent tasks the same way and the timeline reshuffles automatically each time. That cascade, where moving one task pushes everything downstream, is the reason people use a .mpp file instead of drawing boxes in a slideshow.
The Gantt Chart Wizard nobody can find
Here’s a detail that trips up even people who’ve used Project before. There’s an actual Gantt Chart Wizard built in for formatting bars, applying colors, showing things like critical path or slack. Genuinely useful. And in modern versions it’s hidden.
The wizard doesn’t show on the ribbon out of the box. Microsoft tucked it into the commands that aren’t shown by default, so you have to add it yourself. Go to File, then Options, then Customize Ribbon. In the “Choose commands from” dropdown, pick “Commands Not in the Ribbon”, scroll until you find Gantt Chart Wizard, and add it to a custom group on one of your tabs. If you’re looking up “gantt chart wizard project” because the command is missing, that’s why.
Once it’s on the ribbon, running it opens a step-by-step dialog. Microsoft’s support page for the Gantt Chart Wizard walks through the exact prompts, but the short version is that it asks what you want the bars to display and formats them accordingly. No manual styling required.
Just be clear on what the wizard does and doesn’t do. It formats a chart that already exists from your task data. It doesn’t create one from nothing. Empty task table, nothing to work with.
Info: The Gantt Chart Wizard formats an existing timeline, it never generates one. Build your task list and durations first, then run the wizard to style the bars. Running it on an empty file does nothing useful.
Formatting only after the data exists
Once tasks, durations, and links are in place, formatting is the last mile. This is also the order most competing tutorials get wrong, since they push styling early to grab quick screenshots, which teaches people the reverse of a sane workflow.
The Format tab shows up as a Gantt Chart Tools context tab whenever you’re in that view, and it holds most of what you’ll want. Toggle Critical Tasks to highlight the chain that determines your finish date, switch on Slack to show float, or drop text next to bars to label owners and milestones. A proper ms project gantt chart tutorial treats all this as cleanup, not the starting point.
Milestones are worth a quick mention. Enter a task with a duration of zero and Project renders it as a diamond instead of a bar. Handy for approvals, sign-offs, or delivery dates that don’t consume time.
When things look wrong
A few issues come up constantly for first-timers, and none of them mean the software is broken.
Bars appear in the wrong place or won’t move when you’d expect. Usually the task is still set to Manually Scheduled. Flip it to Auto Scheduled and Project takes over positioning based on your durations and links.
Timeline shows nothing even though you typed task names? Durations haven’t been entered, so there’s nothing to draw. Fill in the Duration column and bars appear.
Dependencies don’t cascade. If linking two tasks doesn’t shift dates, check that both are auto scheduled, because a manually scheduled task ignores its predecessor’s finish date entirely.
And if the whole chart is zoomed too far in or out to read, use the timescale controls on the View tab, or the zoom slider in the bottom right, to fit the view to days, weeks, or months depending on how long the project runs.
A note on getting Project legitimately
Microsoft Project is licensed separately from the regular Office suite, which surprises people who assume it came bundled. It’s sold as a standalone desktop license or as part of certain Project Online plans. If your organisation didn’t hand you a key, a genuine standalone license is what activates the desktop app and lets you save real .mpp files.
The edition question trips people up too. Project Standard 2024 covers everything walked through in this guide – task lists, durations, dependencies, the Gantt Chart Wizard – and is enough for anyone managing their own timeline. Project Professional 2024 adds resource management and collaboration features for teams sharing a plan across multiple people, so it’s worth the extra spend only if that’s actually the setup you’re running.
Buyers who want a legitimate license without paying full retail can find genuine, authentic keys through Keyfy’s software license store, delivered by email after checkout. Keyfy sources its licenses through legitimate channels rather than “activator” tools, and support is there if activation needs a hand. Genuine licensing matters more than usual here, because a revoked or counterfeit key can lock you out of the exact .mpp files a whole team depends on.
FAQ
Where is the Gantt chart button in Microsoft Project?
There isn’t one, and that’s the core misunderstanding. Project opens in Gantt Chart view by default, and the timeline populates automatically from your task table. Type tasks and durations, and the chart draws itself. You never insert it as a separate object.
Why is the right side of my screen empty?
Because you haven’t entered durations yet. Bars are generated from the Start, Finish, and Duration fields, so an empty Duration column means an empty timeline. Add a duration to any task and its bar appears immediately.
How do I add the Gantt Chart Wizard to the ribbon?
Go to File, Options, Customize Ribbon, then choose “Commands Not in the Ribbon” from the dropdown. Find Gantt Chart Wizard, add it to a custom group, and click OK. It then runs from wherever you placed it.
Do I need to draw the dependency arrows myself?
No. Select the linked tasks, click the Link button on the Task tab, and Project draws the arrow and adjusts the dates. Manual drawing isn’t part of the workflow.
Can I make a Gantt chart without Microsoft Project?
Yes, tools like Excel or dedicated apps handle it differently, but the .mpp file and its automatic dependency scheduling are specific to Project. For anyone who needs that cascade behaviour, the native tool is the practical choice.
Wrapping up
Building a gantt chart mpp file comes down to trusting that the chart follows the data, not the other way round. If you came here wondering how to make a gantt chart in microsoft project, the answer is to enter your tasks, set durations, link the dependencies, and let the timeline assemble itself. Formatting and the hidden wizard come last, once there’s something on screen to style.
Activate Project With A Genuine Key
Skip the licensing guesswork and get a verified key that activates the desktop app so you can save real .mpp files.
Get A Genuine License →